MP Market Review – April 12, 2024
Last updated by BM on April 15, 2024
Summary
This is a weekly installment of our MP Market Review series, which provides updates on the financial markets and Canadian dividend growth companies we monitor on ‘The List’.
- This week we learn how to take advantage of market mispricing with position sizing.
- Last week, dividend growth of ‘The List’ remained the same and has increased by +8.3% YTD (income).
- Last week, price return of ‘The List’ was down with a return of +1.5% YTD (capital).
- Last week, there were no dividend announcements from companies on ‘The List’.
- Last week, there were no earnings reports from companies on ‘The List’.
- This week, no companies on ‘The List’ are due to report earnings.
DGI Clipboard
“Success in investing has two parts: finding edge and fully taking advantage of it through proper position sizing.
– Michael J. Mauboussin
Gaining An Advantage with Position Sizing

In 2016, Michael J. Mauboussin wrote a paper titled ‘Thirty Years: Reflections on the Ten Attributes of Great Investors’. One of those attributes deals with position sizing.
He uses the example of card counting in blackjack to find an edge and incorporate a betting strategy that takes advantage of it when the cards are in your favour. We do something similar with our dividend growth investing strategy. Let me demonstrate how it works.
Suppose you’ve estimated a sensible, fair value for a company on your watch list, and its share price is below your estimate. You believe there is a margin of safety between the current price and fair value, and you decide to invest. But how much of your capital should you allocate to this business? This is where position sizing comes in. We first pre-determine our maximum and minimum position sizes.
We divide our quality dividend growers into two categories, ‘Core’ and ‘non-Core’. In Canada, ‘Core’ companies are essential to the economy (e.g., telcos, utilities, grocery stores, banks, railroads, and pipelines) and have favourable dividend policies. Next, we choose our ‘non-Core’ companies. These companies are typically low-yield/high-growth businesses that tend to be a bit smaller in size.
We set our maximum position size in ‘Core’ companies at 8% and our maximum position size in ‘non-Core’ companies at 5%. The logic behind our approach is that the sizes are small enough to allow us to include 15-20 (diversification) of the best ideas in our portfolios. We also have a greater concentration in the safest opportunities (Core) with some exposure to faster-growing companies (non-Core).
If our stocks go up and exceed our maximum position size, we can allocate some of that growth to other areas of our portfolio by selling or letting it run a bit further. However, we typically do not let any one position size grow to more than 10% of our portfolio before we start taking some profit. No one ever went broke booking gains!
Conversely, having a minimum position size protects us from too much investment in companies whose fundamentals are not favourable in the short term. Our minimum position size range is 1-4%, depending on the ‘Category’. No matter the valuation, a minimum position size means we will always have a position in the companies we invest in.
An added benefit of having a minimum position size is the case where the stock price continues to rise even though the fundamentals do not support the valuation. How often have you sold a good investment too early and watched it reach even greater highs?
Here are some examples of how we have used position sizing to give us an advantage over a more traditional buy-and-hold scenario. These examples are from our original Wealth-Builder Portfolio, which goes back several years. The ‘Black Line’ is the price, the ‘Blue Line’ is the Normal P/E, the ‘Green Dots’ are when we bought, and the ‘Red Dots’ are when we sold.
Example #1:
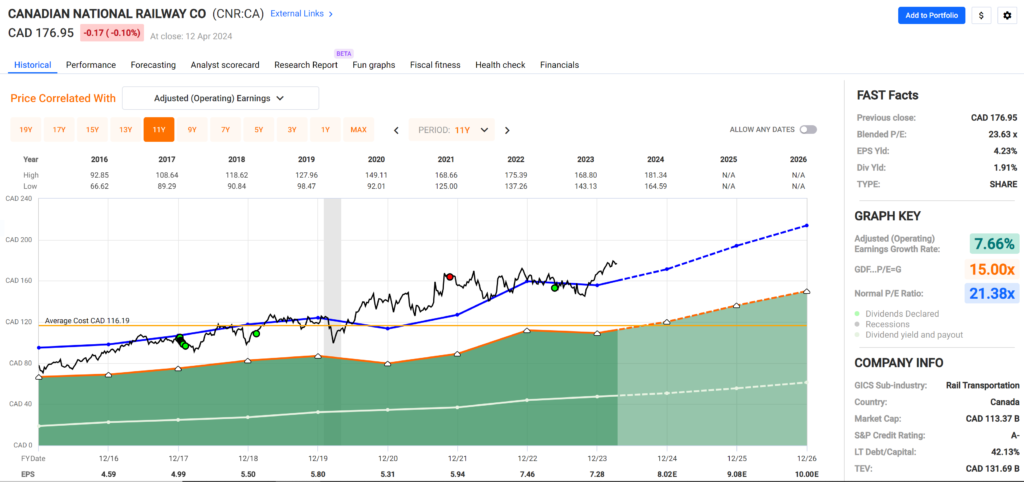
Source: FASTgraphs
In 2017 and 2018, we took advantage of the weakness in the price of Canadian National Railway (CNR-T) and took our position to its maximum. In 2021, we sold a large portion of our position on overvaluation based on the historical pattern this stock typically follows. In 2023, we took our position size up close to its maximum again on price weakness. The stock has rallied once again.
Example #2:
With our next example, Fortis Inc. (FTS-T), we sold due to overvaluation but have had to wait a bit longer to begin adding again.
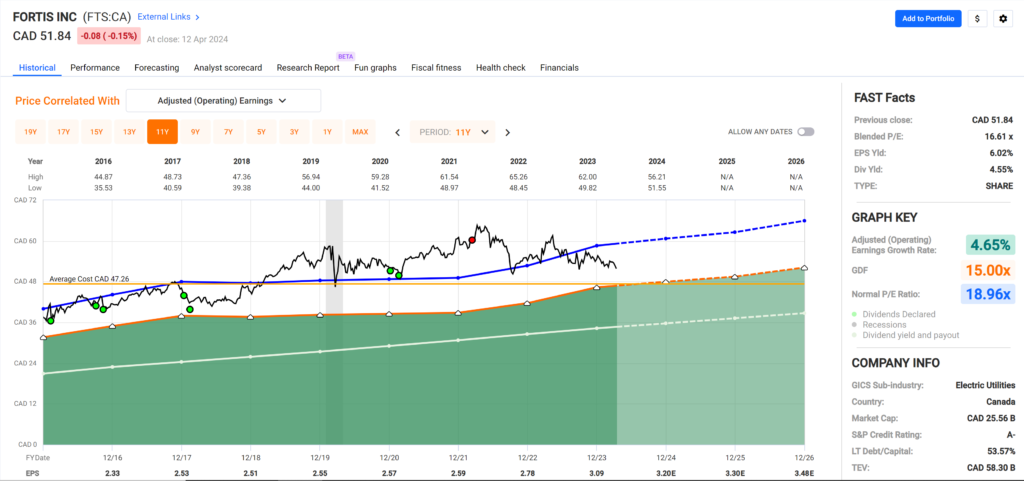
Source: FASTgraphs
From 2015 to 2020, we took our position size to its maximum when we deemed the stock sensibly priced. In early 2022 we were starting to see overvaluation appear based on Fortis Inc.’s unique trading pattern. We decided to sell and took our position size down. We anticipate an entry point with (FTS-T) again very soon.
Example #3:
The next example, TFI International (TFII-T), shows us booking some gains each time our position size reaches its maximum. We did not, however, take our position below its minimum, which turned out to be beneficial as the stock price continued to rise.
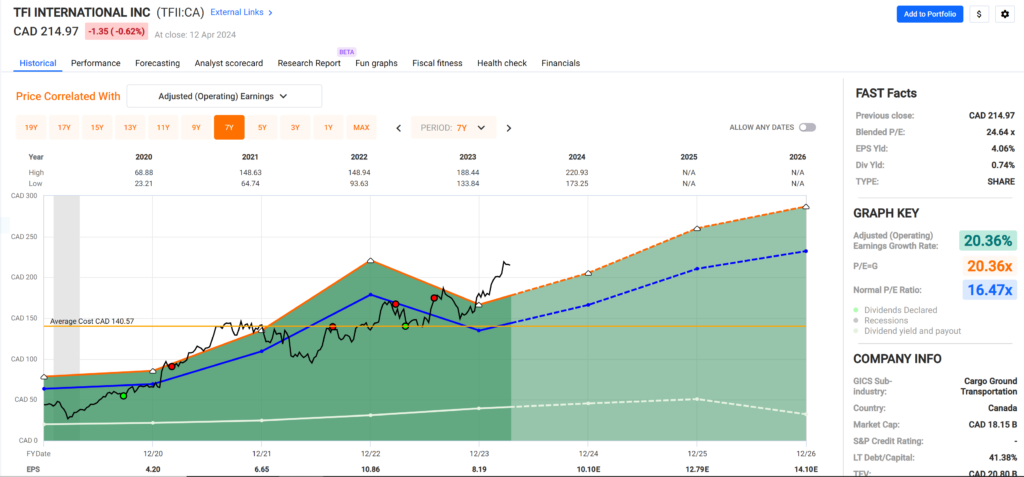
Source: FASTgraphs
This stock price seems always to
In this case, two scenarios could have unfolded. We could have held our original position size for the entire period and benefitted from (TFII-T)’s soaring price. Our position size would now comprise a significant part of our portfolio. Letting your position size grow beyond your pre-determined maximum feels more like gambling than investing. We never want to be too dependent on one stock in our portfolio as we never know what can happen in the business.
Franco Nevada (FNV-N) is a perfect example of this. The stock was rolling along in 2023 and benefitting from the higher gold price until the Panamanian government shut down a mine that provided (FNV-N) a significant royalty stream. The stock dropped 25%! Imagine having a double-digit position size in Franco Nevada, at the time. Keeping your position sizes conservative allows you to sleep well at night while your quality dividend growth stock recovers.
The likely scenario is that we would have sold our entire position when the stock doubled, thinking it was time to take some profits and move on. After all, how much higher could it go? We would then be kicking ourselves for missing out on the meteoric rise of this quality dividend grower.
Incorporating position sizing into our strategy took much of the emotion out of what to do and worked well with our investment in (TFII-T).
When our good dividend growers are overvalued, we sell some. When they are undervalued, we buy some. Although we are not proponents of ‘market timing’ (frequent trading), incorporating position sizing into our DGI strategy has helped us to take advantage of stock market mispricing.
DGI Scorecard
The List (2024)
The Magic Pants 2024 list includes 28 Canadian dividend growth stocks. Here are the criteria to be considered a candidate on ‘The List’:
- Dividend growth streak: 10 years or more.
- Market cap: Minimum one billion dollars.
- Diversification: Limit of five companies per sector, preferably two per industry.
- Cyclicality: Exclude REITs and pure-play energy companies due to high cyclicality.
Based on these criteria, companies are added or removed from ‘The List’ annually on January 1. Prices and dividends are updated weekly.
While ‘The List’ is not a standalone portfolio, it functions admirably as an initial guide for those seeking to broaden their investment portfolio and attain superior returns in the Canadian stock market. Our newsletter provides readers with a comprehensive insight into the implementation and advantages of our Canadian dividend growth investing strategy. This evidence-based, unbiased approach empowers DIY investors to outperform both actively managed dividend funds and passively managed indexes and dividend ETFs over longer-term horizons.
For those interested in something more, please upgrade to a paid subscriber; you get the enhanced weekly newsletter, access to premium content, full privileges on the new Substack website magicpants.substack.com and DGI alerts whenever we make stock transactions in our model portfolio.
Performance of ‘The List’
Last week, dividend growth of ‘The List’ remained the same and has increased by +8.3% YTD (income).
Last week, price return of ‘The List’ was down with a return of +1.5% YTD (capital).
Even though prices may fluctuate the dependable growth in our income does not. Stay the course. You will be happy you did.
Last week’s best performers on ‘The List’ were Telus (T-T), up +0.46%; Canadian National Railway (CNR-T), up +0.37%; and Thomson Reuters (TRI-N), up +0.29%.
Brookfield Infrastructure Partners (BIP-N) was the worst performer last week, down -10.4%.
| SYMBOL | COMPANY | YLD | PRICE | YTD % | DIV | YTD % | STREAK |
|---|---|---|---|---|---|---|---|
| ATD-T | Alimentation Couche-Tard Inc. | 0.9% | $75.43 | -1.7% | $0.70 | 17.4% | 14 |
| BCE-T | Bell Canada | 9.0% | $44.23 | -18.4% | $3.99 | 3.1% | 15 |
| BIP-N | Brookfield Infrastructure Partners | 6.3% | $25.84 | -15.8% | $1.62 | 5.9% | 16 |
| CCL-B-T | CCL Industries Inc. | 1.7% | $68.61 | 18.6% | $1.16 | 9.4% | 22 |
| CNR-T | Canadian National Railway | 1.9% | $176.95 | 6.0% | $3.38 | 7.0% | 28 |
| CTC-A-T | Canadian Tire | 5.5% | $127.82 | -7.8% | $7.00 | 1.4% | 13 |
| CU-T | Canadian Utilities Limited | 5.9% | $30.17 | -6.1% | $1.79 | 0.0% | 52 |
| DOL-T | Dollarama Inc. | 0.3% | $112.05 | 17.9% | $0.35 | 29.5% | 13 |
| EMA-T | Emera | 6.1% | $47.07 | -7.3% | $2.87 | 3.0% | 17 |
| ENB-T | Enbridge Inc. | 7.8% | $47.07 | -2.7% | $3.66 | 3.1% | 28 |
| ENGH-T | Enghouse Systems Limited | 3.3% | $29.88 | -12.0% | $1.00 | 18.3% | 17 |
| FNV-N | Franco Nevada | 1.2% | $118.05 | 7.2% | $1.44 | 5.9% | 16 |
| FTS-T | Fortis Inc. | 4.6% | $51.84 | -5.5% | $2.36 | 3.3% | 50 |
| IFC-T | Intact Financial | 2.2% | $219.25 | 7.8% | $4.84 | 10.0% | 19 |
| L-T | Loblaw Companies Limited | 1.2% | $146.59 | 14.0% | $1.78 | 2.4% | 12 |
| MFC-T | Manulife Financial | 5.0% | $31.95 | 10.6% | $1.60 | 9.6% | 10 |
| MGA-N | Magna | 3.8% | $49.84 | -10.2% | $1.90 | 3.3% | 14 |
| MRU-T | Metro Inc. | 1.9% | $70.61 | 3.1% | $1.34 | 10.7% | 29 |
| RY-T | Royal Bank of Canada | 4.1% | $135.66 | 2.0% | $5.52 | 3.4% | 13 |
| SJ-T | Stella-Jones Inc. | 1.4% | $79.60 | 3.9% | $1.12 | 21.7% | 19 |
| STN-T | Stantec Inc. | 0.7% | $110.55 | 5.6% | $0.83 | 7.8% | 12 |
| T-T | Telus | 6.9% | $21.87 | -7.8% | $1.50 | 5.2% | 20 |
| TD-T | TD Bank | 5.2% | $78.29 | -7.6% | $4.08 | 6.3% | 13 |
| TFII-N | TFI International | 1.0% | $156.14 | 19.0% | $1.60 | 10.3% | 13 |
| TIH-T | Toromont Industries | 1.5% | $128.93 | 14.3% | $1.92 | 11.6% | 34 |
| TRI-N | Thomson Reuters | 1.4% | $152.38 | 6.3% | $2.16 | 10.2% | 30 |
| TRP-T | TC Energy Corp. | 7.7% | $49.73 | -4.9% | $3.84 | 3.2% | 23 |
| WCN-N | Waste Connections | 0.7% | $167.12 | 12.8% | $1.14 | 8.6% | 14 |
| Averages | 3.5% | 1.5% | 8.3% | 21 |
Note: Stocks ending in “-N” declare earnings and dividends in US dollars. To achieve currency consistency between dividends and share price for these stocks, we have shown dividends in US dollars and share price in US dollars (these stocks are listed on a US exchange). The dividends for their Canadian counterparts (-T) would be converted into CDN dollars and would fluctuate with the exchange rate.
Check us out on magicpants.substack.com for more info in this week’s issue….
